2023 Assessment Insights in Student Affairs
Note: The following is a guest post written by Dr. Joe Levy, Associate Vice Provost of Accreditation and Quality Improvement at Excelsior University, about Applying & Leading Assessment in Student Affairs — an open online course co-sponsored by Modern Campus.
Assessment of student learning is one of the most cited areas of concern or need for improvement for higher education institutions across accreditors. Within that space, assessment for student affairs and co-curricular areas has been one of the top areas lacking among institutional practices.
Most concerning in the face of that reality is the lack of staffing, resources and even familiarity with student affairs assessment. For these reasons and more, the Student Affairs Assessment Leaders (SAAL) continue to invest and promote their free massive open online course (MOOC), Applying & Leading Assessment in Student Affairs.
The course has run once a year for the past seven years and consistently sees over 90% course quality ratings, and indication materials and activities have had a positive impact on them. It averages more than 1,500 participants per year and consistently brings in more folks due to the relevance of the material paired with the lack of resources and guidance available at institutions for faculty, staff and administrators on the subject. A free, self-paced, introductory course with an abundance of resources and practical activities to ground the material has proven successfully popular and useful to thousands of people.
Each year, Joe Levy – who serves as the Open Course Manager for the SAAL Board of Directors – conducts analysis from course participant results and feedback on the course experience. This serves as a great recap of the course experience for the year, as well as implications for changes to influence the next iteration of the course.
This blog provides a summary of the data analysis and results from the 2023 open course that ran from February to April of 2023. The reporting resulted in 92 total pages, opening with a 5-page executive summary and followed by reports for the Welcome Survey/User Profile, Quiz Results, Assignment Rubric Results, and User Experience/End of Course Survey Results. The executive summary has hyperlinks to these respective reports and data disaggregation elements summarized. Since that’s a lot of reading, the post below shares the highlights.
Enrollment
This year, we saw 1,542 participants enroll in the course, with 222 of them successfully completing it. This 14.3961% completion rate is just shy of the 15% completion rate from 2021 and 2022 where rules of rounding would put this year at 14%. Despite the slightly lower completion rate, we saw almost 500 more students sign up this year compared to last. We’re excited about the continued course interest!
Welcome Survey/User Profile
Participants are largely hearing about the course from friends of colleagues, from SAAL, or through social media. They take the course because they enjoy learning about topics that interest them and hope to gain skills for a promotion or new career. While they have online experience from school or through other MOOC providers, course takers identify almost split as passive and active participants for this course (especially when looking at completers vs all respondents) and they anticipate spending one or two hours per week on the course.
The majority of course takers have 40% or less of their jobs dedicated to assessment and identify as intermediate or beginners with respect to their assessment competency. They hold all sorts of roles at institutions, primarily staff and managers or directors in a variety of functional areas —with the highest concentrations in Institutional Effectiveness, Career and Academic Advising, and Student Engagement and Involvement. They represent all types of institutions, but the largest concentration are in public 4-year universities with over 10,000 students, private 4-year universities with under 10,000 students, and community colleges with under 10,000 students. While we have course takers from all over the world, the vast majority are from North America, speak English as their native language, and live in suburban or urban areas.
Course participants typically have master's degrees; the next largest group has terminal degrees. The course welcomed all ages of participants, but the most populated age groups were 25-34, 35-44, and 45-54. Course participants are mostly female and primarily identify as women. While many races and ethnicities were represented, the majority of participants identified as White.
Because course completers had very similar demographic distribution/profile as the initial sample of survey respondents, the above narrative profile holds true for them, too. These results also largely mirror last year’s results.
Quiz Results
Overall, quiz results were very positive with respect to demonstrated student learning. The mode quiz scores were the max values (100% correct score) per respective quiz, so average quiz scores are shown here to offer a bit more variability with respect to student performance in each quiz. Even with the averages, each quiz average is 93% correct or higher. Average scores for overall participants were slightly below (1-2% points) last year’s results for all quizzes except one (Quiz 1), but all at or above 93%.
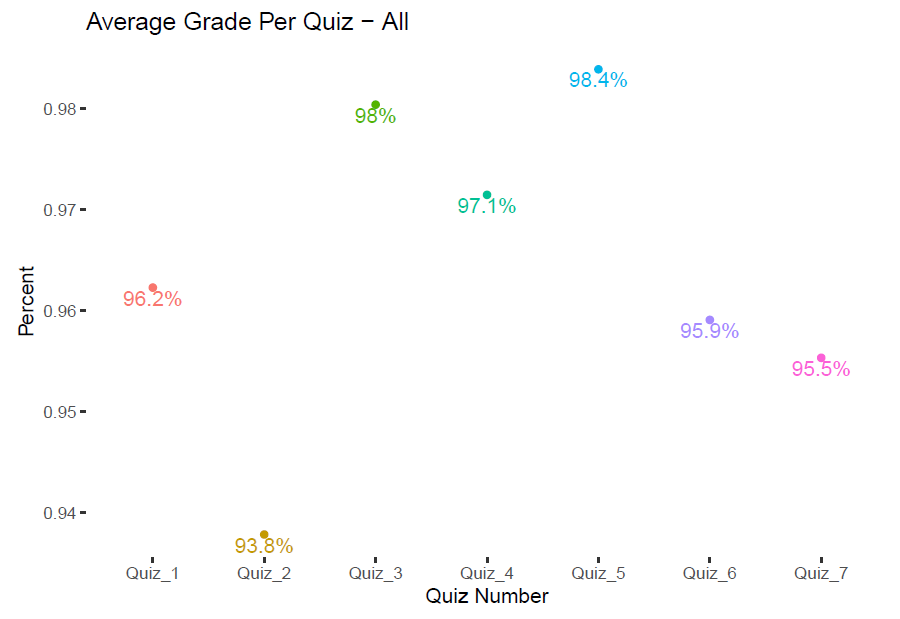
Completer quiz results are more positive than the overall quiz results, but I’ll stick with just sharing overall results here for consistency with what was reported last year. Next year, we can adjust to share overall vs. completer scores for quizzes year over year.
Data Disaggregation
Overall quiz results were disaggregated by completer demographics. As such, results are filtered from all course participants (1,542) to those who completed the course (222). Then, the results are further filtered to remove course participants who did not consent to their data being used for reporting purposes, bringing the sample to 217. Finally, results per demographic question may vary in sample size due to consenting course completers who may not have answered specific demographic questions or taken the Welcome Survey at all (where demographic data is gathered) – a maximum possible sample size of 209 based on completers taking the Welcome Survey.
Across quiz scores and demographics, groups did fairly well overall, which makes sense considering all quiz scores averaged 93% or higher. Looking across a given demographic's scores (i.e., across all groups within a given demographic), the most participants with overall quiz scores of 95% or higher was sex and gender group (both at 61%), assessment competency groups (58%), and race and ethnicity groups (53%).
Assignment Results
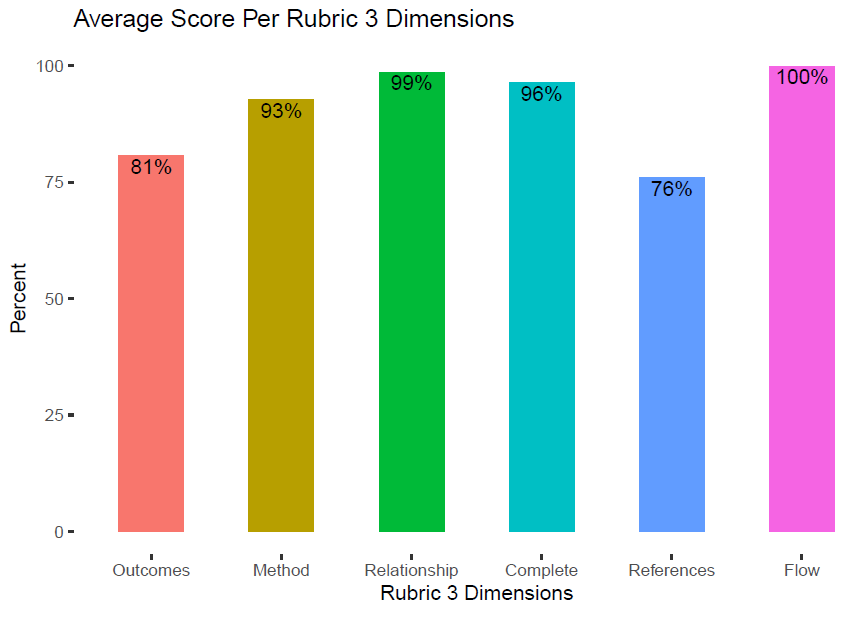
Overall, participants who completed the course did pretty well on assignments. Participants needed a score of 75% or better on each assignment to count toward earning the course badge. The mode score for the Module 3 assignment was 30 out of 30 overall, with the following mode scores per rubric dimensions: Outcomes 5/5, Method 5/5, Relationship 5/5, Complete 5/5, References 5/5, and Flow 5/5. Last year, the results were exactly the same.
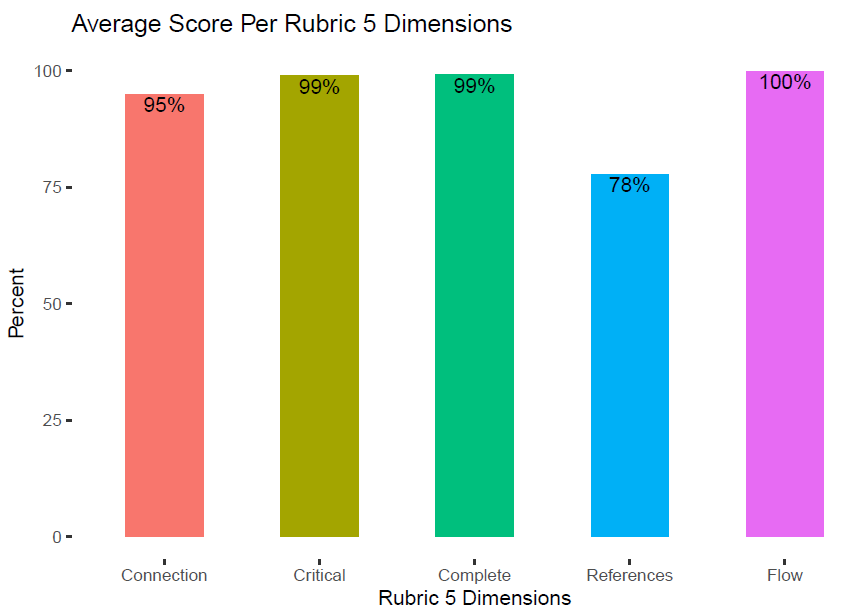
The mode score for the Module 5 assignment was 25 out of 25 overall, with the following mode scores per rubric dimension: Connection 5/5, Critical lens 5/5, Complete 5/5, References 5/5, and Flow 5/5. Last year, the results were exactly the same.
Overall, course participants performed very well on the assignments. It is worth mentioning that these data points were not filtered for course completers; aside from people who did not want their data to be used for analysis purposes, these data reflect all submitted assignments by course participants. The next section of the report dives get into a more detailed performance of participants per assignment rubric.
Data Disaggregation
In looking to analyze the results, responses were filtered for only participants who consented to using their data for assessment or report-related purposes. This resulted in a sample of 246 participant artifacts for the Module 3 assignment and 223 participant artifacts for the Module 5 assignment. It is worth noting these resulting samples of 246 and 223 differ from overall course completers (222) since successful course completion requires scoring 75% or better on each quiz and on each written assignment.
Across rubric scores and demographics, groups did fairly well overall (which makes sense considering the mode score for module 3 was 30/30 and module 5 was 25/25). Aggregate, completer and noncompleter rubric performance this year were almost exactly the same or better as last year for Module 3 and Module 5 assignments. Across self-reported assessment competency, sex, and gender populations, 75-78% of folks across groups earned an 87% or better on Module 3 and 70-76% of folks across groups earned a 92% or better on Module 5. Race and ethnicity breakdown was a bit less consistent: 50% or more folks across groups earned an 87% or better on Module 3 and 67% or more folks across groups earned a 92% or better on Module 5.
User Experience Survey/End of Course Evaluation Results
End-of-course evaluation occurs by way of a user experience survey offered to all participants. The initial sample of 216 respondents was filtered for only participants who consented to using their data for assessment or report-related purposes. For comparison purposes with other course data sets, respondents were further filtered by participants who successfully completed the course and earned the course badge. This resulted in a sample of 182 responses.
- 96% of respondents agreed or strongly agreed to positive impact of course materials (videos, lecture material, readings). These results are 1 percentage point higher than last year.
- 95% of respondents agreed or strongly agreed to a positive impact of course activities (quizzes, assignments, discussion boards). These results are the same as last year.
- 73% of respondents indicated they spent 2 hours or fewer on the course each week (down from 75% last year), with another 20% spending 3-4 hours per week (up from 18% last year).
- 62% of respondents indicated a likelihood to recommend the course as a 9 or 10 (down from 66% last year), with another 18% responding with an 8 (down from 25% last year).
- 95% of respondents rated course quality as 4 or 5 out of 5 stars. This year's data is up from last year's result of 94% responding with 4 or 5 stars.
- 68% of respondents indicated instructor involvement should be a variety (up from 67% last year), while 27% indicated they like to learn on their own (same as last year). Peer to peer learning, interacting only with instructor, and no instructor interaction made up the remaining 5%.
- 49% of respondents indicated a course length preference of 7-8 weeks (down from 51% last year), 30% indicated a preference of 5-6 weeks (down from 35% last year).
Data Disaggregation
The disaggregated data by demographic focused on two end-of-course questions: actual hours spent each week on the course and overall quality of the course.
Overall, time spent on course results across and within demographic groups largely mirror the aggregate results (73%). It was interesting to see how some results for 2 hours or fewer vary from disaggregation by one demographic to another. It was fun to review the initial anticipated hours as a population in relation to actual hours spent on the course. Drawing from Welcome Survey results, 69% of all respondents indicated they anticipated spending 2 hours or less on the course —not far off from end results here.
Course quality ratings across and within demographic groups largely mirror the aggregate results (95%).
This year’s data disaggregation (across course data sets) looked a little different from last year. More detail is provided in the respective data set reports. While we commit to doing some form of data disaggregation next year, it is a long-term goal to conduct further analyses to dig deeper than the descriptive statistics reported in order to truly examine relationships between variables.
Qualitative Analyses
When looking at the user experience survey, the majority (68%) of comments were positive, with multiple comments containing suggestions for improvement. Thinking through the suggestions for improvements, as well as the negative feedback, the instructors will reflect on ways to address the following as possible course changes in 2024:
- Reviewing and revisiting videos and PowerPoints for appropriateness and updates
- Provide more course experience navigation videos and resources
- Continue thinking of ways to make discussions more engaging, personalized, and manageable
- Review quiz questions to ask more application-based questions versus memorization/recall
- Consider more resources for analyzing data/Module 6 content
- Continue adding to live session/synchronous engagement opportunities
We’ve always received feedback from more advanced folks in the profession saying the course wasn’t as challenging for them, and this year was no different. We struggle with this feedback since the course is aimed to be introductory in nature, but we also recognize there are likely few people and institutional practices doing all of the things discussed in this course well, so there’s always room to learn and grow. As instructors, we’re always sharing how the course is a great refresh and reality check for us as we self-reflect on our practice and how we always are learning great perspective from those who take the course and share about challenges, successes, and questions related to their experiences. We’ll keep tinkering, as well as finding ways to encourage more experienced folks to find meaningful ways to leverage the course experience.
All of this information is useful as direction, guidance, and direct feedback for what is working well, what to improve, and what participants are looking for with respect to experience in the course. The course instructors take these data sets very seriously and work to have the participant voice reflected in the many improvements and enhancements made to the course.
Thank You
We would be remiss if we did not express our gratitude for the co-sponsors of the 2023 course. Efforts this year were made possible due to the generous partnership and support from Enflux, Modern Campus, Weave, and the Assessment Network of New York (ANNY).
Anyone who wants the latest course information or stay abreast about the next course iteration should visit SAAL's open course webpage.
Conclusion
From the beginning, the purpose of the course has been to support professionals hoping to learn more about engaging in and leading assessment for student affairs and co-curricular areas. This continues to be a popular, well-reviewed, and positively impactful experience for those who engage.
More important than people spreading the word to join the next iteration of the course, we hope people will use the information gained to better engage their institution in the work and, most importantly, collaborate across campus to create the best environment for student learning. Continuing to navigate online and hybrid environments, as well as changing demographics and needs in today’s students, we hope folks earnestly act to understand and make data-informed decisions around interventions to best support student success.

Last updated: October 3, 2023
Related Blogs

Blog
What Frustrates Students Most About Higher Ed Websites
Understand what students say frustrates them about higher ed websites and learn how to build a website that meets their...

Blog
How Site Search for Higher Education Improves Your Website
Site search is an important feature of higher education websites so that all users—students, parents, and faculty—can...

Blog
How Small Colleges Can Survive and Thrive by Serving the Lifelong Learner?
Supporting learners through every life stage, small and specialized colleges stand to create a pool of lifelong learners...